Code
library(colorspace)I haven’t always been diligent in ensuring visualisation colours work for everyone, but recently working with a colourblind colleague forced me to pull my socks up.
I plan to review past work on this blog and make improvements where I can; this post is a reference for me in the first instance, and I hope might be useful to others as well.
library(colorspace)I’ve probably been using the colorspace swatchplot() function more than anything else to check palettes, especially custom palettes that I’d use in ggplot’s scale_*_manual functions.
There are other tools I use (see lists below), but for me this is the quickest one for quickly testing a palette within R. (Some other packages have similar simulators which I haven’t tried yet.)
It’s handy with named palettes too; here’s the viridis palette (specifying 8 colours), with simulation of all three of the main colour blindness types to facilitate comparison:
swatchplot(sequential_hcl(8, "Viridis"), cvd = TRUE)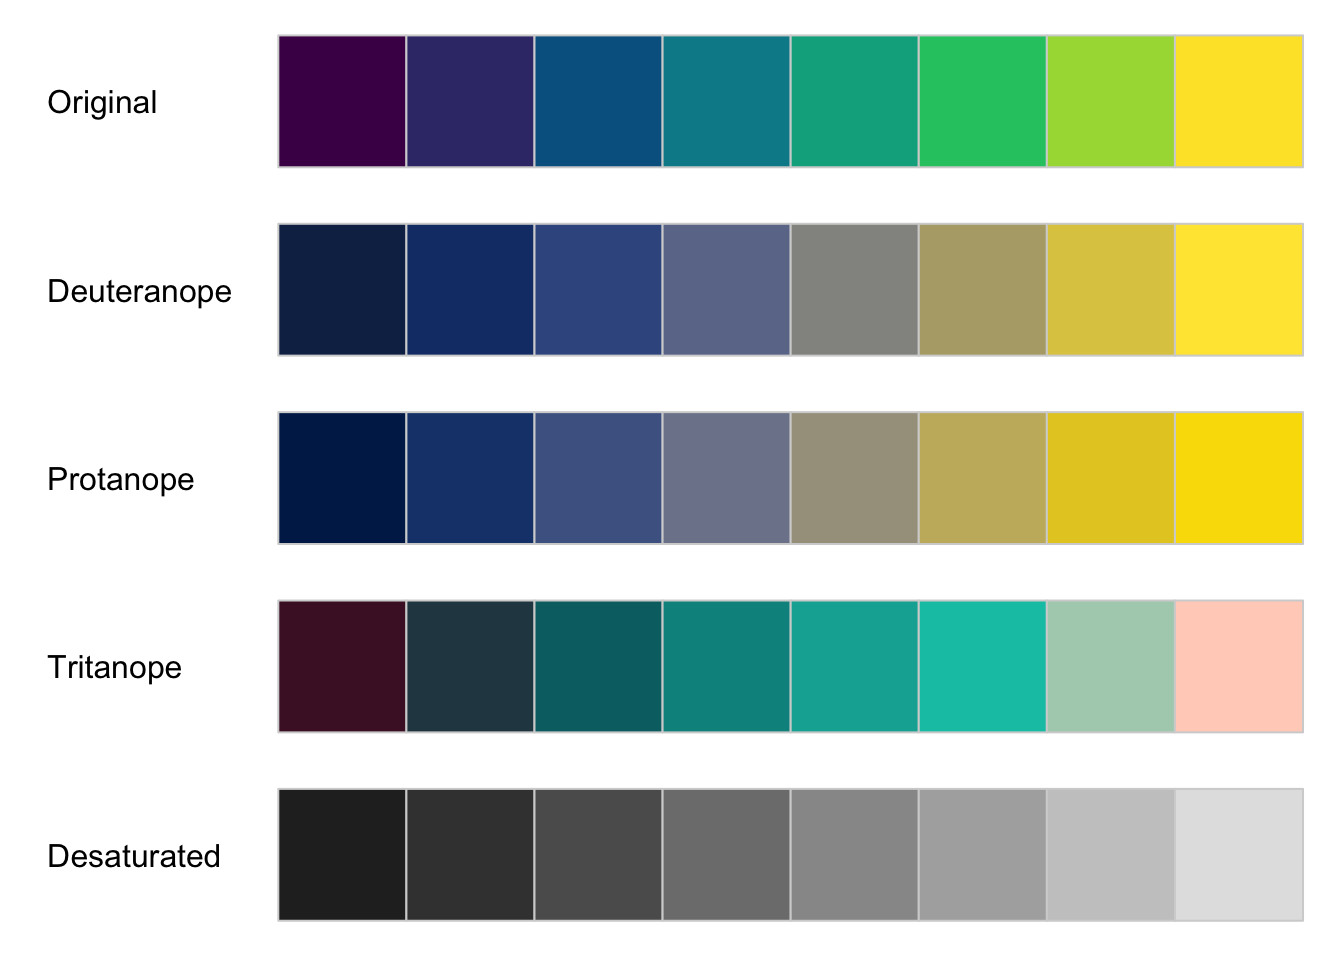
And for a diverging palette (ColorBrewer):
swatchplot(diverging_hcl(7, "Purple-Green"), cvd = TRUE)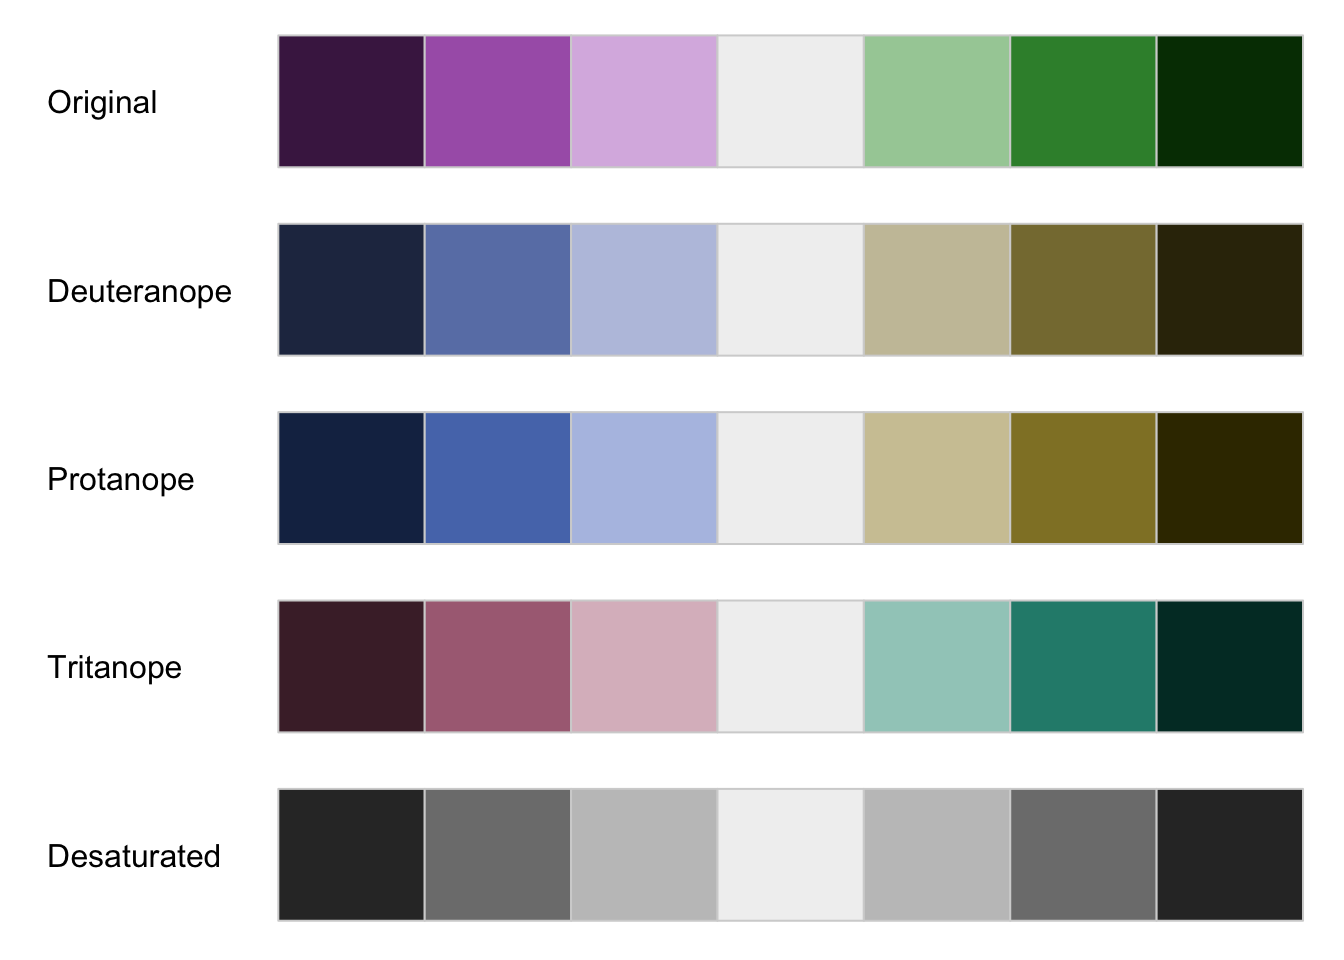
But I think swatchplot really comes into its own if you want to test and tweak a custom palette. You can just give it a vector of colours.
This is a red-green-blue combination. It’s… not good.
swatchplot(c("#F8766D", "#00BA38", "#619CFF"), cvd=TRUE)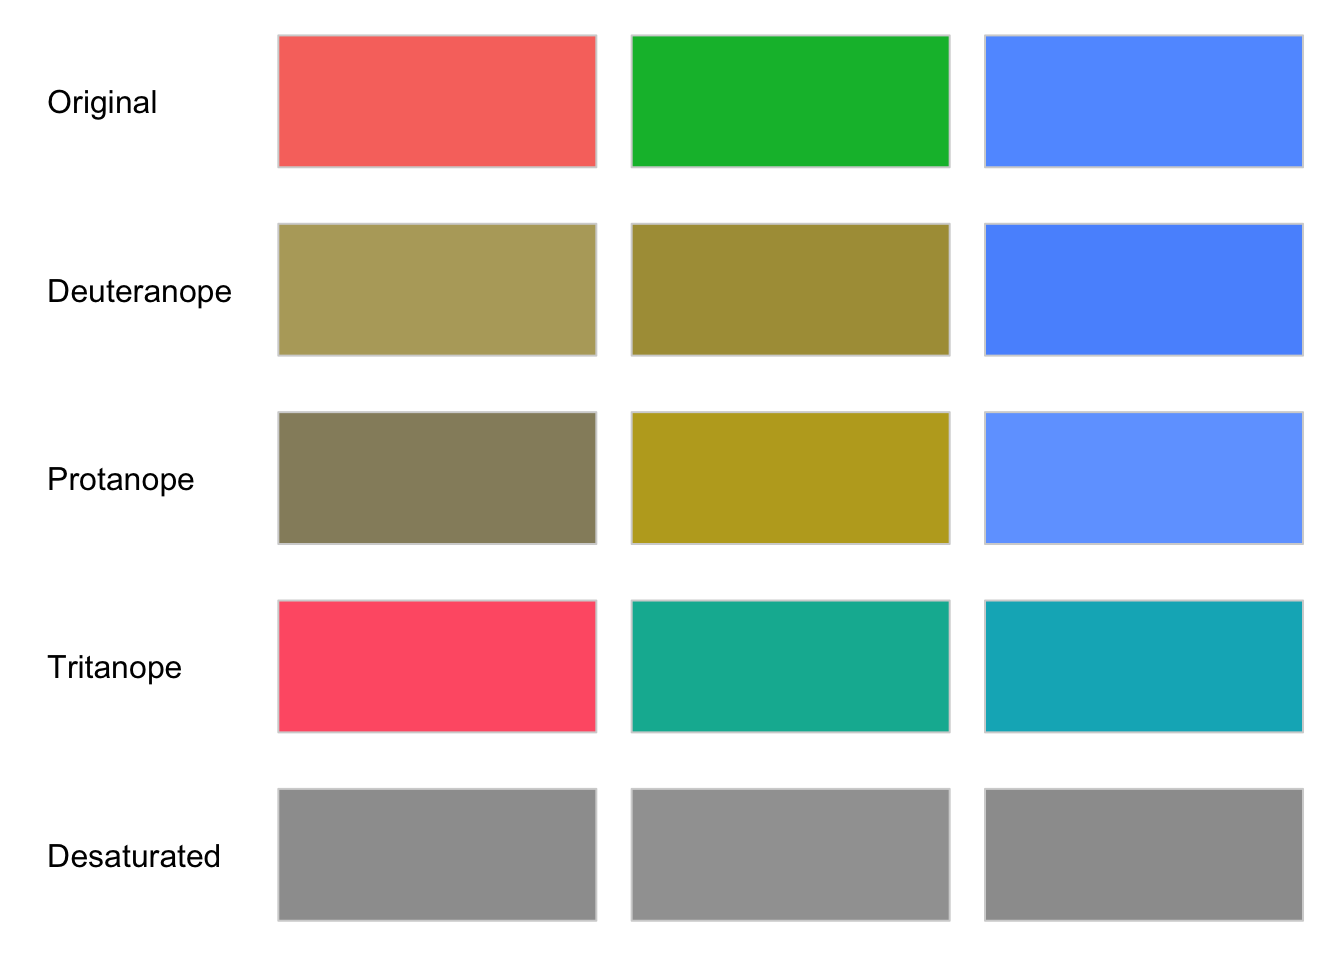
Something better (colours from Paul Tol’s light qualitative scheme).
swatchplot(c("#EE8866", "#EEDD88", "#99DDFF", "#44BB99", "#BBCC33"), cvd=TRUE)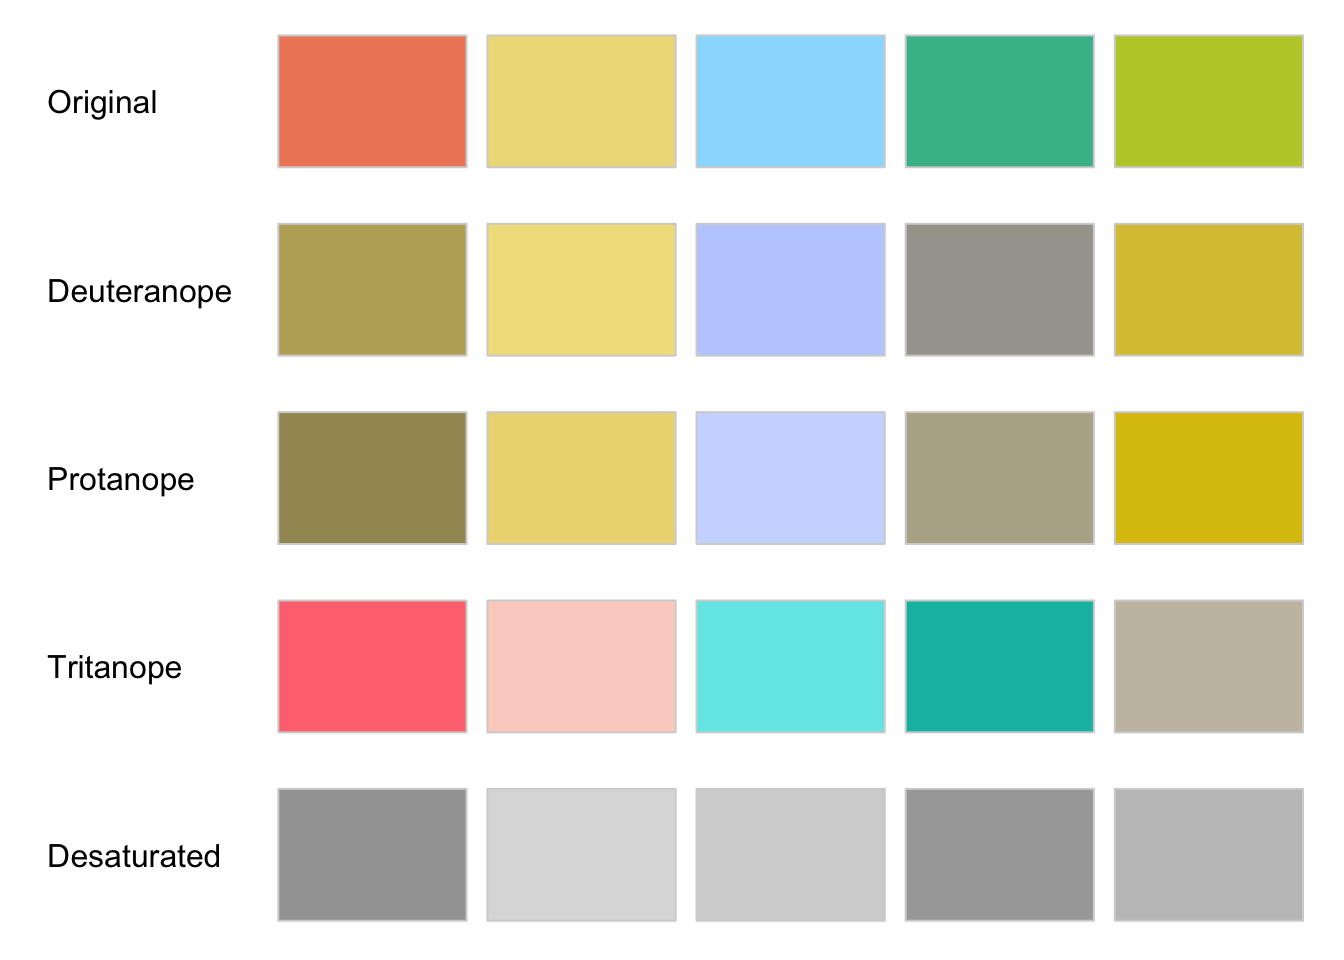
If you need a three colour scheme, these are the colours in Paul Tol’s high-contrast palette:
swatchplot(c('#DDAA33', '#BB5566', "#0072B2"), cvd=T)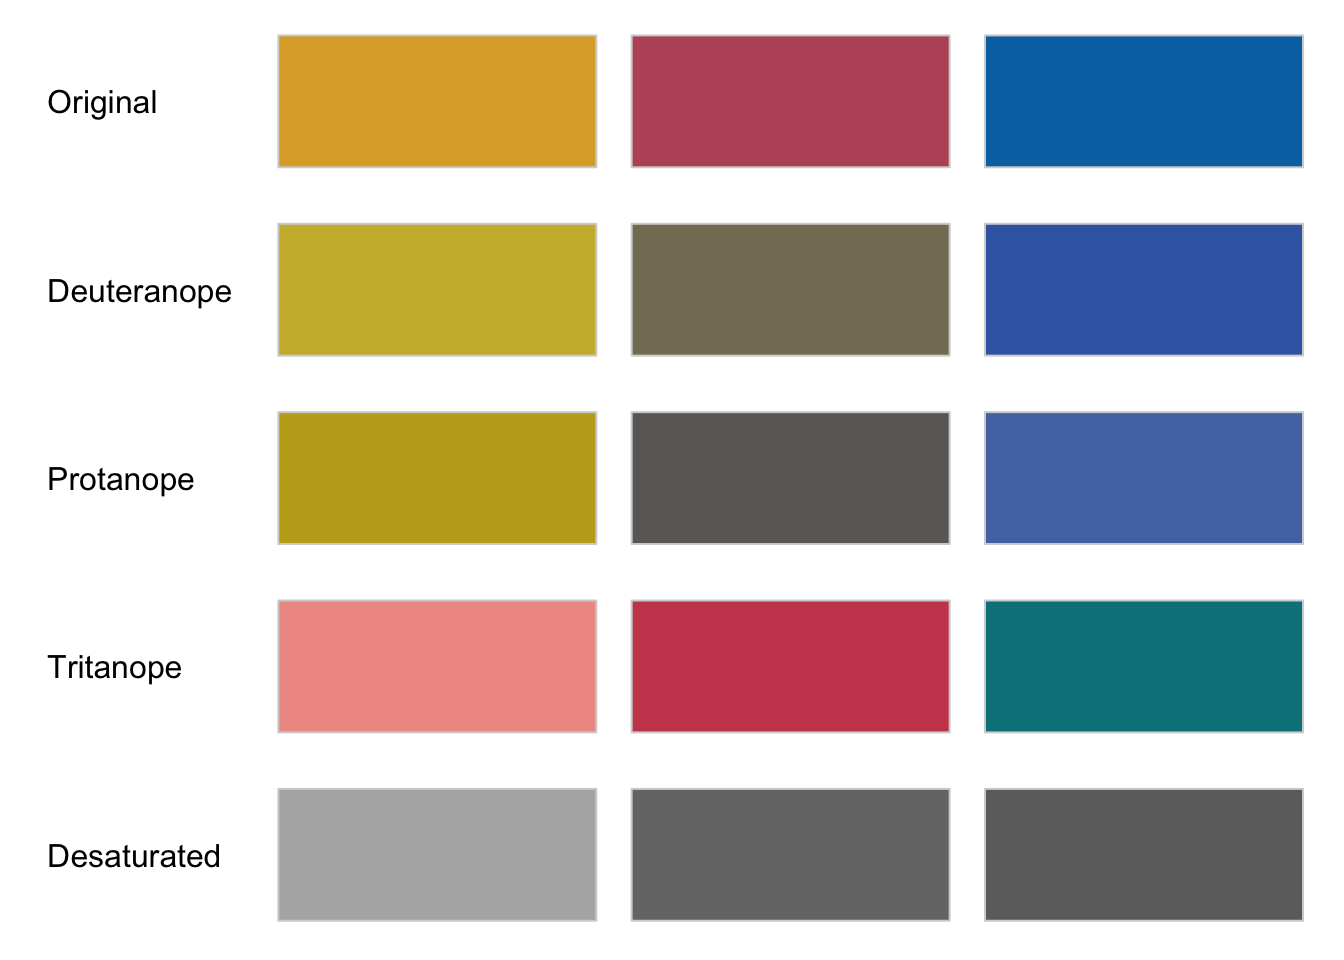
With colorblindr you can go a step further than the swatchplot and simulate actual visualisations; this may be particularly useful for line graphs and scatterplots where you can get rather different effects than the blocks of colour in bar charts and the like.
# install colorblindr from github
#remotes::install_github("clauswilke/colorblindr")

library(ggthemes)
library(colorblindr)
library(ggplot2)
library(palmerpenguins)
Scatterplot of the Palmers Penguins dat, using the default ggplot colour palette (as a general rule: don’t do this; it’s ugly as well as being abysmal for the colourblind).
pp <-
penguins |>
  dplyr::filter(!is.na(sex) ) |>
  ggplot(aes(bill_length_mm, bill_depth_mm, colour = species)) +
  geom_point()

pp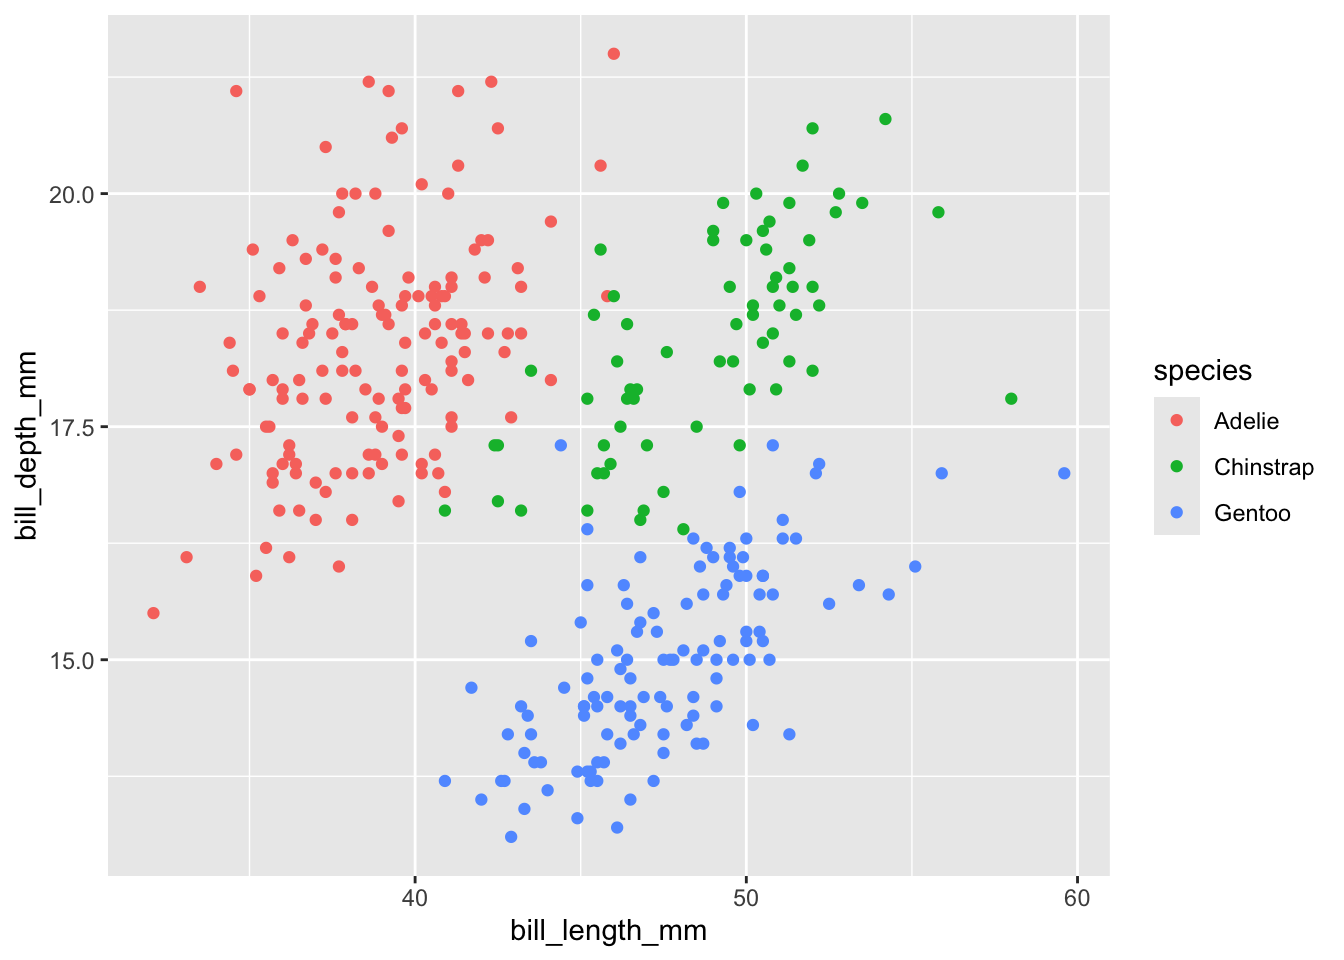
Simulations:
cvd_grid(pp)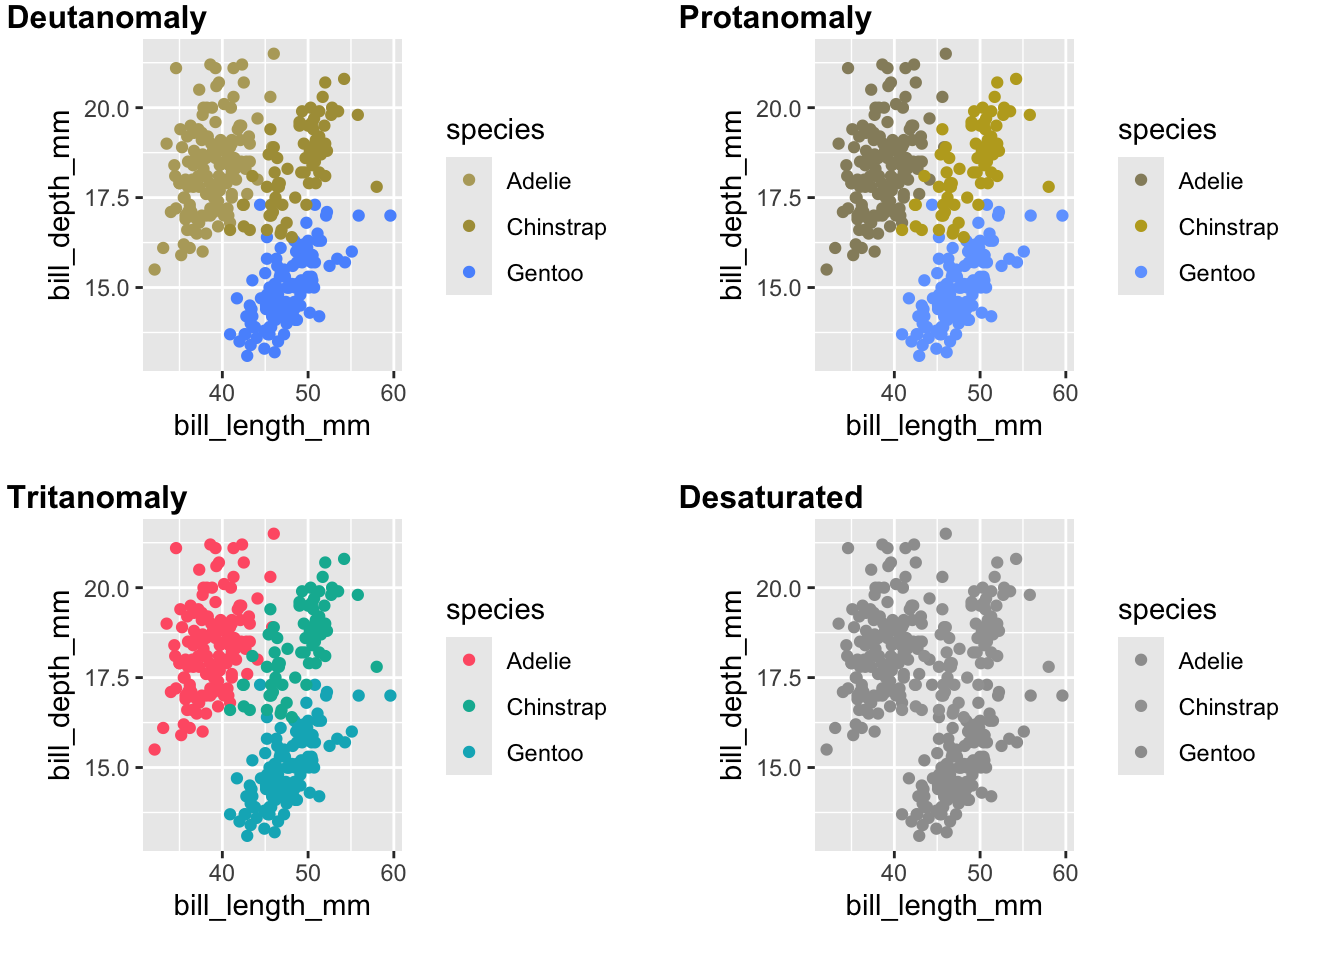
cvd_grid(pp + scale_colour_colorblind())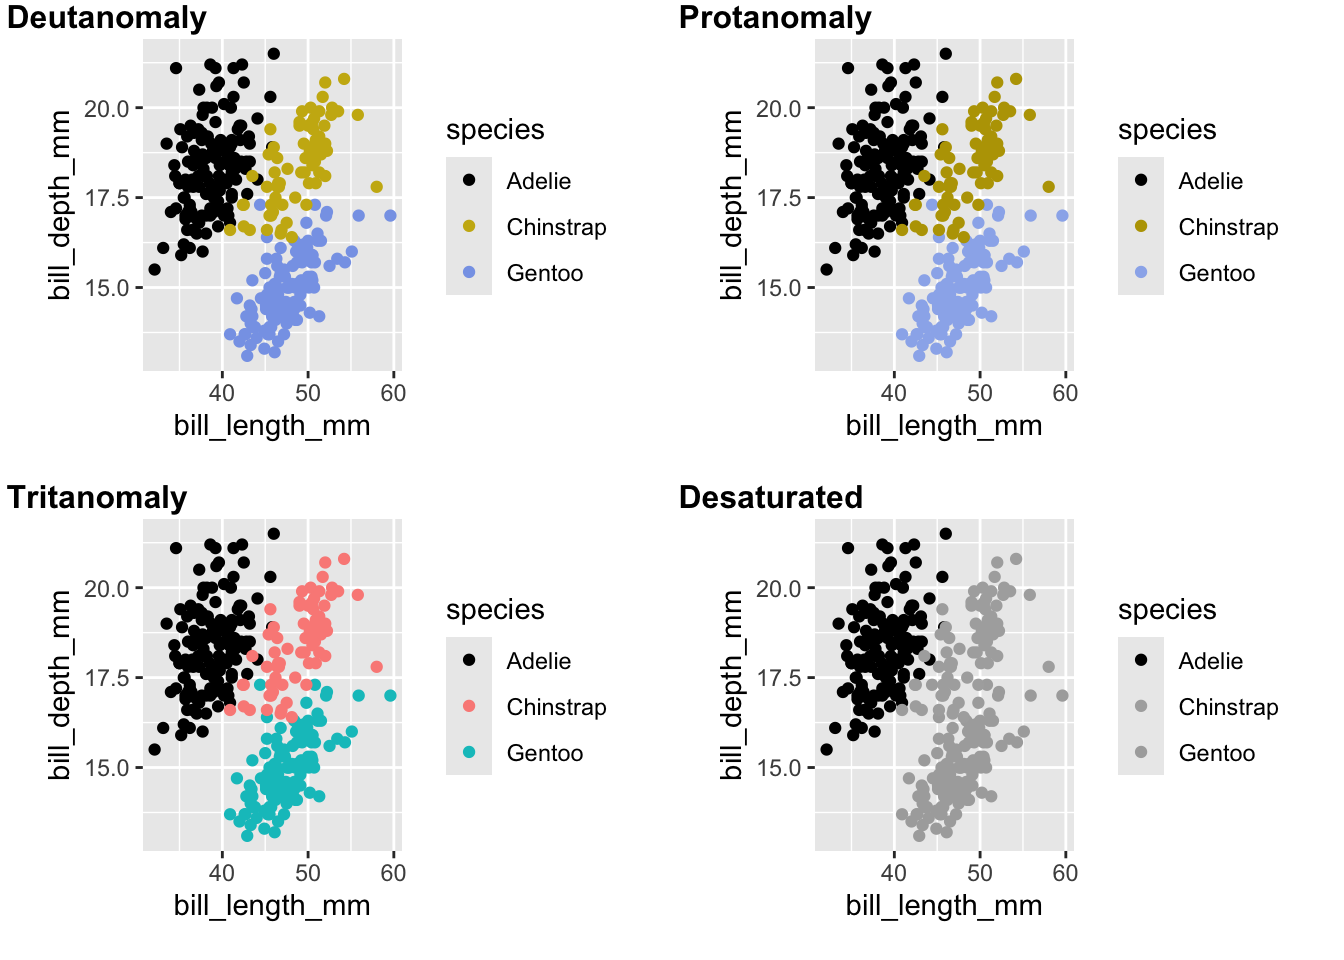
cvd_grid(pp + scale_colour_ptol())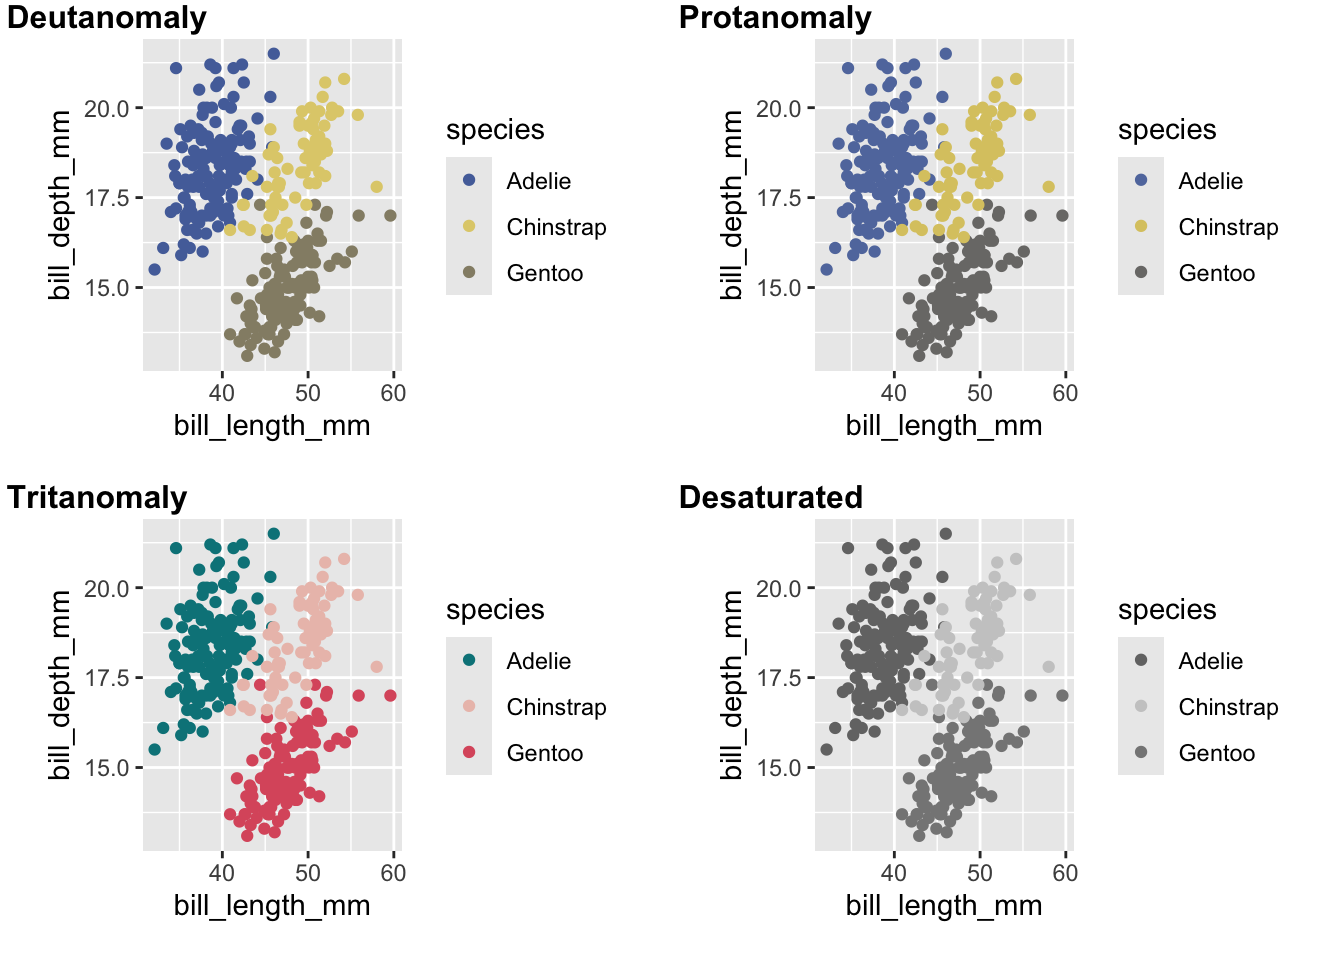
Useful tools:
Blog posts etc:
Some R packages:
Okabe and Ito:
Paul Tol:
Beyond colour blindness, I’ve been reading Jonathan Godfrey’s work for blind R users: